
Measures of central tendency also known as averages of first order are the statistical value that represent the entire series of data as a central figure around which all values of the series gather. Averages are derived from the series i.e., they are calculated from the series and may or may not be a part of series. Hence, they are derived figures but not captured as original data. The motive behind calculating the average is to obtain a single figure that can represent the entire series of set of data.
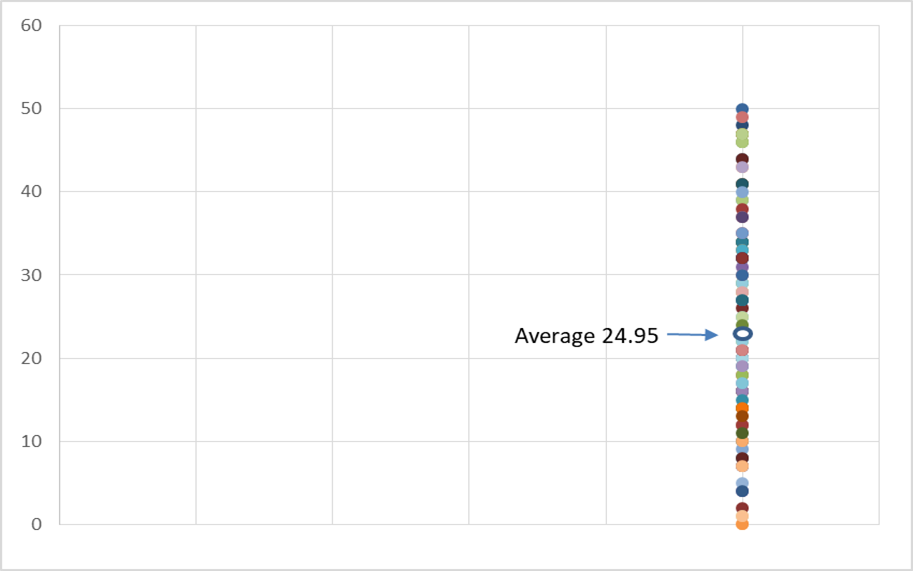
Following figure lets you understand how the average marks of the students are at the center of the data and the marks of the students congregate around it.
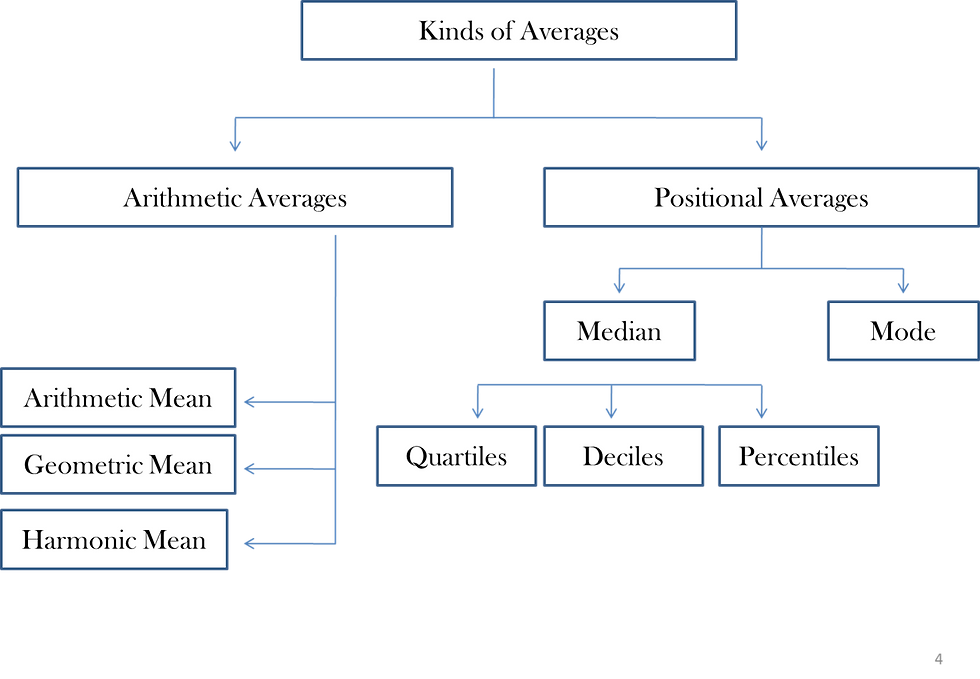
Kinds of Averages
Characteristics of a Good Average
A good average should be;
Rigorously defined.
Easy to compute.
Capable of simple interpretation.
Dependent on all values of observation.
Not unduly affected by one or two extremely large or small values.
Should fluctuate relatively little from one random sample to another.
Be capable of mathematical manipulation.
Arithmetic Mean
The arithmetic mean for ungrouped data is defined as;

Mathematically,


For Instance;
1. Find arithmetic mean of the values 5, 7, 1, 3, 4, 10.
Here n=6, therefore

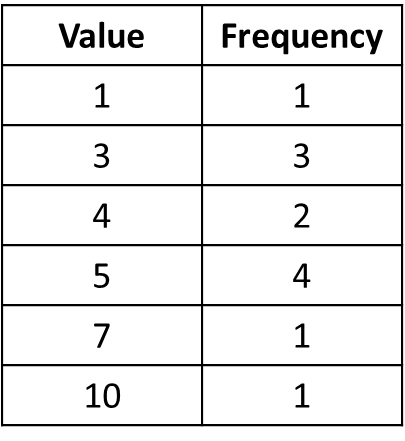
2. Find arithmetic mean of the values 5, 3, 3, 5, 5, 7, 5, 1, 3, 4, 4, 10.

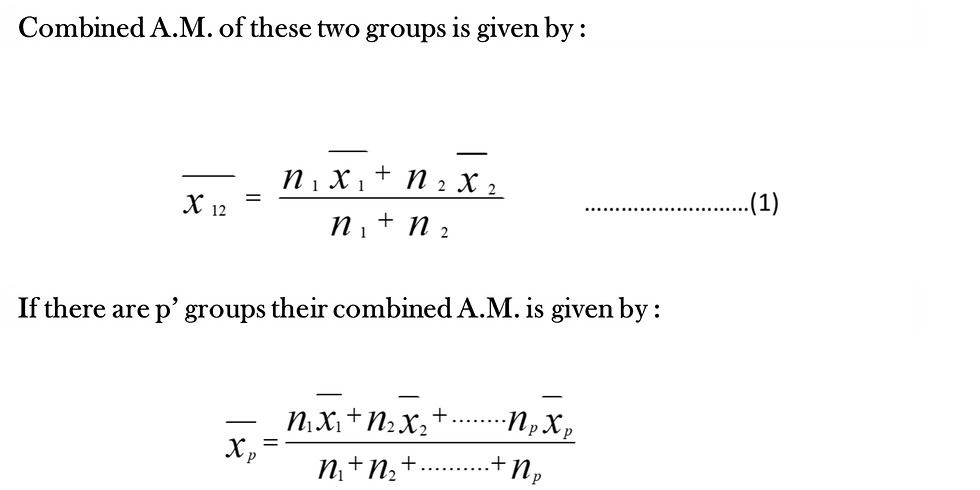
Combined A.M. of two Groups
Combined Arithmetic Mean of two groups defined such that;


Weightage Arithmetic Mean
Suppose a man purchases mangoes @ Rs. 20 per kg, apples @ Rs. 30 per kg and oranges @ Rs. 16 per kg, then the average rate of purchase will be:
Rs (20 + 30 + 16)/3 = Rs 22 per kg
But what if man purchases 5 kgs of mangoes, 2 kgs of apples and 6 kgs of oranges.
The weightage Arithmetic mean in such case is given by;

Properties of A.M.
If a constant amount is added, subtracted, multiplied or divided from each value in the series, mean is also added, subtracted, multiplied or divided by the same constant amount. For example; Following are the salaries of employees in a firm of a particular department 30 k, 50 k, 90 k, 15 k, 16 k. Manager HR decides to give an incentive of Rs 2 k to each employee as a reward of the best performing department during the financial year. The manager wants to calculate the increment in average salary which was Rs 40.2 k . What should he do? The manager HR should also add the average which was 40.2 k by 2 k. This way the new average results in 42.2 k.
The algebraic sum of the deviations of all values from their mean = 0.
In case of frequency distribution, the algebraic sum of the deviations of all values from their mean.

4. If the mean and number of values are given but one value is missing in the series,
Missing value = (Number of values ´ Mean) – (Sum of known values)
5. If one or two values have been taken wrongly while calculating the mean then,

Arithmetic Mean of the Grouped Data
In Grouped data the middle value of each group is representative of the group i.e. in grouped data, each item in the group is considered to be equal to the middle value of that group. Therefore the Sum of values in each group = Middle value of the group ´ Number of values.
Example
From the data below, find the missing frequency if the Arithmetic Mean is 33.
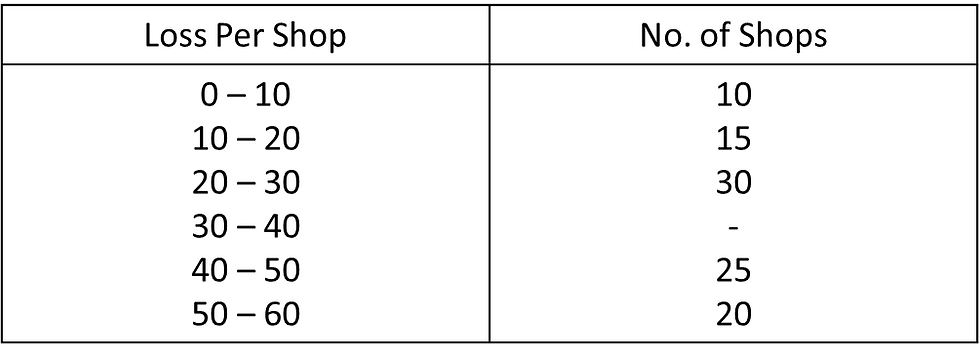
Let the missing frequency be f.
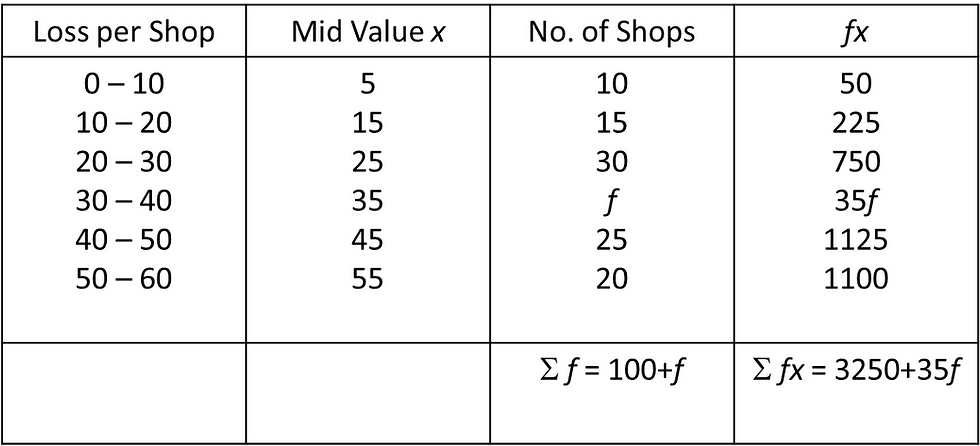
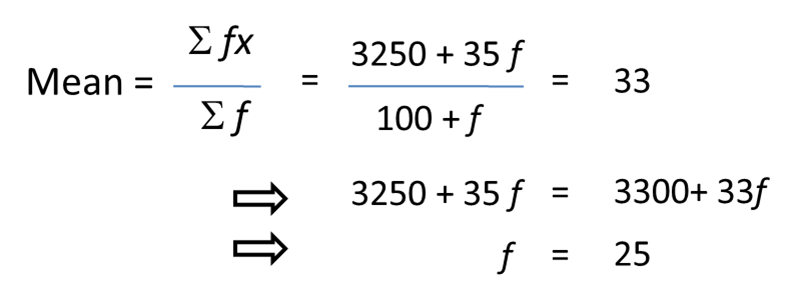
Short Cut Method of Calculating Arithmetic Mean
This method is used when we deal with large figures;
Steps to follow
Take any value (though not necessary but the value among the given is taken). Call this value as the assumed mean, called as ‘A’.
Calculate the deviation of all the values from this assumed mean ‘A’ and take the mean of these deviations.
Add the mean of the deviation to the assumed mean

In case any common factor in the deviation, then divide each deviation by that common factor (in continuous series the common factor in most of the cases = the class interval), i.e. find d/i = d’, where ‘i’ is the common factor.

This is also called Step-deviation Method.
Example
If the sum of the deviation of a set of 10 values taken from 35 is 60, find the value of the A.M.

Geometric Mean
Sometimes when we are dealing with quantities that change over a period of time, we need to know an average rate of change, such as average growth rate over a period of several years. In such cases, the simple arithmetic mean is inappropriate, because it gives the wrong answers. We need to know ‘geometric mean’ simply called G.M. G.M. is generally used in situations where small items are assigned large weights and vice versa. The following are the some uses of geometric mean:
G.M. is useful to calculate average percentage increase or decease.
In the construction of Index numbers, geometric mean is considered to be best average tool.


Combined G.M. of two Groups


Example;
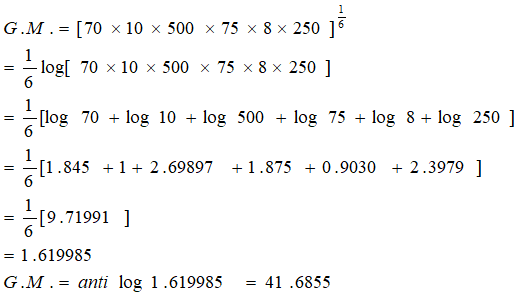
Calculate the G.M. of the following data.
70, 10, 500, 75, 8, 250.
Given, log 70=1.845, log 500=2.69897, log 75=1.875, log 8=0.9030, log 250=2.3979
Antilog 1.619985 = 41.6855
Example:
Find the G.M. of 3, 6, 24, 48.

Geometric mean for Measuring rate of change is given by;

Relationship between G.M., H.M., and A.M.,

Median
According to Connar, “The median is that value of the variable which divides the group in to two equal parts, one part comprising all values greater, and other all values less than median”.
To find the median of ungrouped data the data is arranged either in ascending order of magnitude or descending order of magnitude. After arranging the data in any of the two ways the middlemost value gives the median.

Example
Find the median of the following series
2,10, 5, 7, 15, 17, 21, 13, 4
and 2,10, 5, 7, 15, 17, 21, 13, 4, 22.
After arranging the values in ascending order we have:
2, 4, 5, 7, 10, 13, 15, 17, 21……………………………….(1)
2, 4, 5, 7, 10, 13, 15, 17, 21, 22………………………….(2)
Series (1) contains 9 items, therefore {(9+1)/2}=5th value = 10 is the median.
Series (2) contains 10 items, therefore

Median is influenced by the position of the items in the array but not by the size of the items.
Median of Grouped Data
In grouped data, the individual items lose their identity, and the middle item can not be found by counting. Therefore, it is necessary to get inside of a class to find to find the value that divides the number of all items in half . If we divide the number of frequencies (N) in two halves.
We cumulate the frequencies until the we reach the lowest class whose cumulative frequency is greater than (N/2).
This class is a median class. Median class is the lowest class whose cumulative frequencies contain the value (N/2). When the class intervals are arranged in ascending order. Clearly the median value is more than the lower limit of the median class and less or equal to the upper limit of the median class.
Assuming that all items are evenly distributed over this median class, We proceed toward the upper limit of this class, Stopping when we have reached at the frequency equal to (N/2), this operation brings us to a value with in the median class which is presumed to have (N/2) items on each side of it.
As already stated, median value is at-least as high as the lower limit of the median class but can not be higher than the upper limit of the median class.


Steps to find Median of Grouped Data
Divide the number of items in the distribution by 2, i.e. compute the value of (N/2).
Accumulate i.e. cumulate the frequencies.
Find the class whose cumulative frequency is first to exceed N/2. This is the median class.
Find the actual lower limit of the median.
Then perform the following operations: Subtract from N/2 the frequencies we have accumulated before entering the median class. Divide this difference by the frequency of the median class. Multiply the quotient thus obtained by the size of the class interval of the median class.
Add the result of the operation in step 5 to the lower limit of the median class. This sum gives the median.
The formula associated with the process is


For finding the median for grouped data also, the class intervals should be arranged in ascending order of the magnitude.
Related Positional Measures
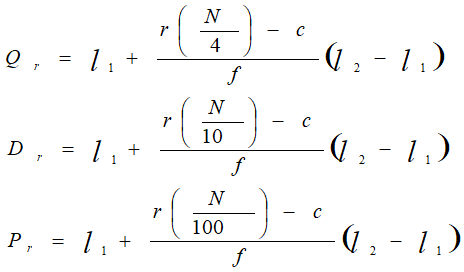
There are some other measures that divides the series into equal parts like quartiles divide the data into four equal parts, Deciles divide the data into 10 equal parts and Percentile divides the data into 100 equal parts.
Following are the formulae for finding them:

Mode
Mode is the most common value, i.e., the value having maximum frequency in the series. For example
The retail price paid for a commodity by most of the customers in the model price.
In a factory the wage being paid to most of the workers in modal wage.
In grouped frequency distribution the class having the highest frequency is the model class.
According to Zizek, Mode is “the value occurring most frequently in a series of items and around which the other items are distributed most densely.
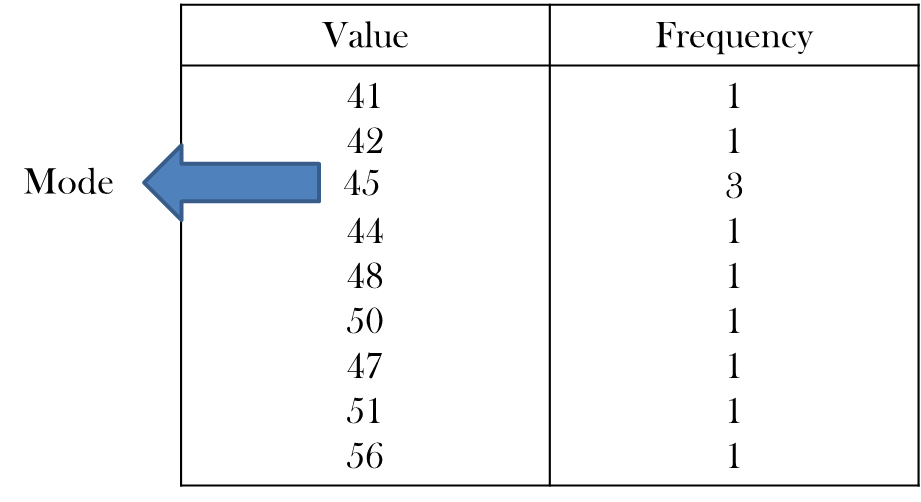
Example: Find the mode of the following data :
41, 42, 45, 44, 45, 48, 50, 45, 47, 51, 56.
Arranging the distribution as frequency distribution, we get
Mode by Grouping Method
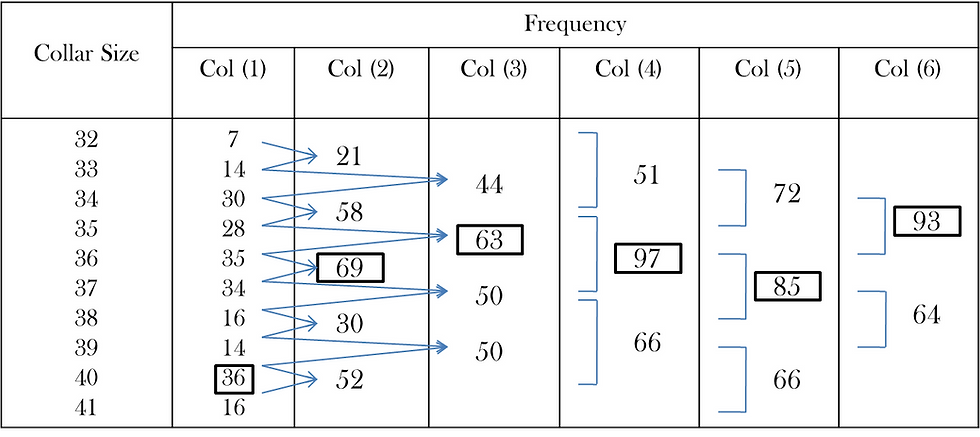
For this method a grouping table has to be maintained:
Column 1: Contains the original frequencies arranged in ascending order and the maximum frequency is marked by putting a mark or a circle.
Column 2: The frequencies are grouped twos, the total remaining frequencies are grouped in tows and the highest total is marked.
Column 3: Leaving the first frequency, the remaining frequencies are grouped in twos and the highest total is marked.
Column 4: The frequencies are grouped in threes. The highest total is marked.
Column 5: Leaving the first frequency, the remaining frequencies grouped in threes and the highest total is marked.
Column 6: Leaving the first two frequencies, the remaining frequencies are grouped in threes and the highest total is marked.
After completing the group table analysis table is formed for finding the value or the observation which is repeated the highest number of times.
Example: The following table gives the measurement of collar size of 230 students in a university. Determine the model size of the collar.

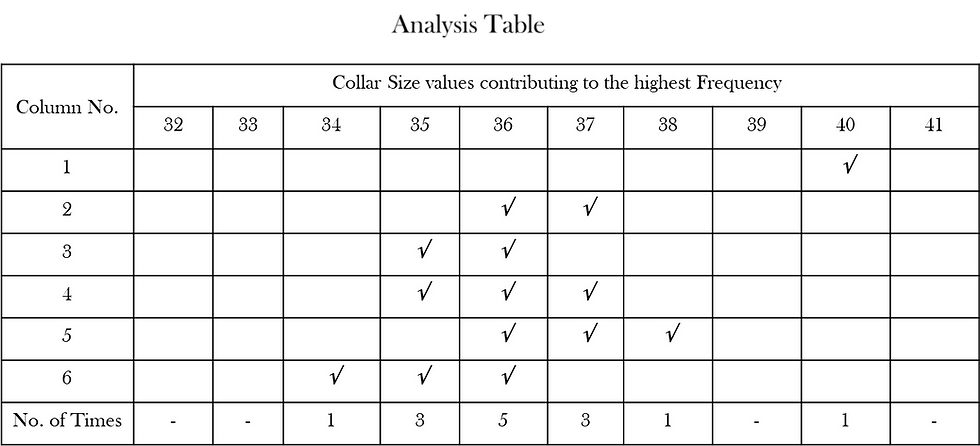
From analysis table we observe that size 36 is repeated the highest number of times. Therefore, Model size is 36 cms.
Determination of Mode in Continuous Series
In this method the class having the maximum frequency is known as the modal class. In case nearly equal concentration of frequencies is observed in two or more classes, the grouping method can be used to determine the model class. Afterwards following formula is applied to define mode:


Comments